[ comparison · published 2026-09-02 · updated 2026-09-20 ]
Hierarchy Totals vs Epic Sum Up for Jira (2026)
Hierarchy Totals · by Claused — compared with Epic Sum Up on the Atlassian Marketplace ↗ · written by Andrey Pavlov
Short version: Epic Sum Up lives inside the issue — a Summary Panel with progress bars on every epic, budgets, personnel cost, a spreadsheet-like editor and timesheets — and computes its numbers live when you open it. Hierarchy Totals lives on the dashboard — one gadget that rolls a numeric field up the hierarchy for up to 50 projects from a stored copy, with a date on every render and a daily trend. If you want the roll-up where the work happens, Epic Sum Up is the category leader. If you want one trustworthy number over a large portfolio, keep reading.
Disclosure
We make Hierarchy Totals, so read this the way you would read any vendor’s comparison. Every statement about Epic Sum Up below comes from public information — its Marketplace listing, its help center, its FAQ and public reviews — paraphrased, linked and checked on 2026-09-02. We say plainly where Epic Sum Up is the better choice, and there are several such places.
What each product is
Epic Sum Up (listed by APTIS GmbH & Co. KG as ESU – Sum Up KPI & Budget Reporting Project Epic Overview; 1,755 installs, rated 4.1 across 44 reviews, checked on 2026-09-02) adds a Summary Panel to parent issues with progress bars and counters, a dashboard gadget, a Detail View Editor for inline and bulk editing, timesheets on work logs, budget markers and personnel cost, and “containers” — its own parent type for building hierarchies of any height. It runs on Jira Cloud, Server and Data Center and has carried Marketplace reviews since January 2016. A separate free edition (2,880 installs, rated 3 across 43 reviews, checked on 2026-09-02) rolls up the three time-tracking values into a Summary Panel on epics.
Hierarchy Totals is one Jira Cloud dashboard gadget with one job: roll a numeric field — story points, estimates, time — up Jira’s issue hierarchy (sub-task → story → epic → any Advanced Roadmaps level above) for up to 50 projects in one tile. It offers sum, average, min, max, count and a median of the values present in the subtree; an Open work only mode; the DONE column showing how much of the work under each row is done; an amber badge counting unestimated leaves; a daily trend of the totals; and drill-down — expand any row, or show only the branches that still have unestimated work. It is on the Atlassian Marketplace; the docs describe the shipped build.
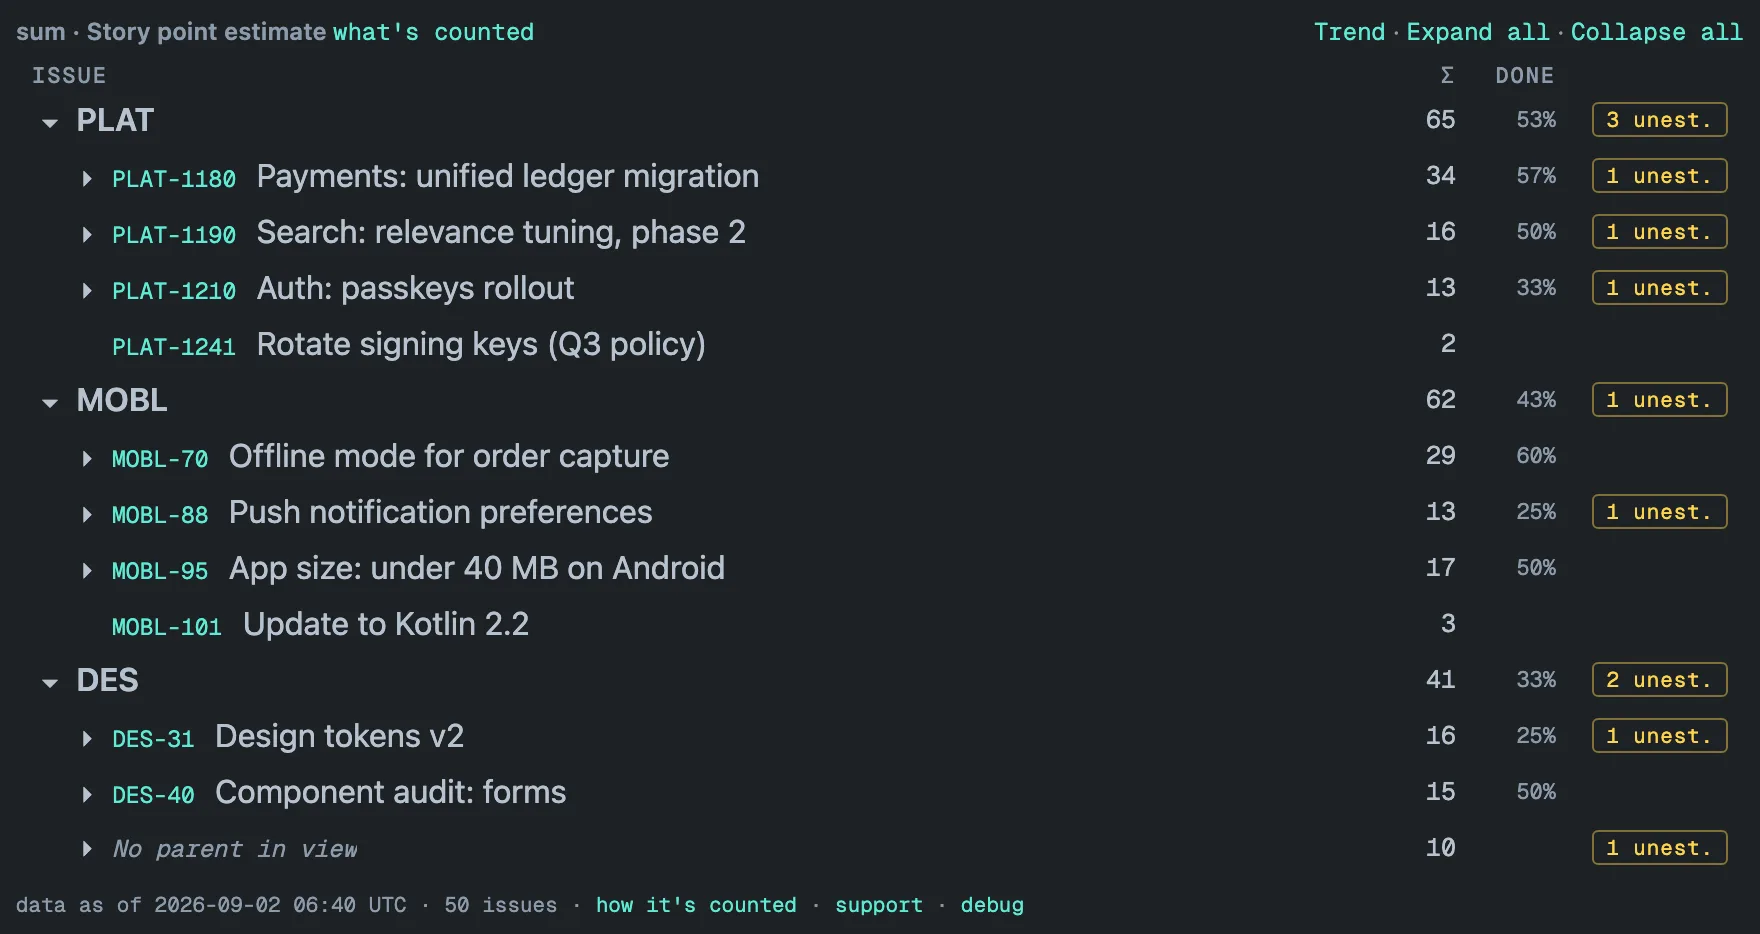
If your question is “how is this epic doing, in hours and money, and can I fix its children right here?”, Epic Sum Up answers it and we do not. If your question is “what is the total across these twelve projects, is it current, and how has it moved since July?”, read on.
Where the computing happens
Epic Sum Up computes on open. Its help center describes the Summary Panel as live reporting whose data is not cached but calculated by a live algorithm each time; its FAQ explains that the summed values are therefore not stored at issue level, because storing them would mean constant recalculation and slower servers; and its features page positions the app for working with over a thousand issues at once (features, FAQ, both checked on 2026-09-02). That is a sound design for an issue-view panel: one epic’s subtree is small, and the numbers are always as fresh as Jira.
Hierarchy Totals starts from the opposite premise, because a dashboard tile over a portfolio is not small. The work happens before you open the dashboard: a background sync keeps a stored copy of every configured project inside your Jira site — Atlassian-hosted storage attached to the site — runs a full re-read once a day and an hourly update in between. Opening the dashboard reads that copy and draws it. We took this route after hitting the alternative: Forge, the Atlassian platform the gadget is built on, allows about 25 seconds per render, and a single project of more than 30,000 issues ran into that wall before we moved the work out of the render.
Two practical consequences:
- Scale. A 31,000-issue portfolio renders in about a second and a half; 13 projects and 47,000 issues render in under three seconds. Both are render times of the stored copy, and the time is driven mainly by how many issues the gadget covers — up to the 50-project and 50,000-issue caps on the limits page.
- A visible date instead of a spinner. The stored copy is usually less than an hour old (deleted or moved issues are picked up by the daily full re-read), so every render carries a “data as of” stamp in the footer, and the tile warns when its numbers are more than 48 hours old. While the first background pass runs — minutes on a small site, an hour or more on a large one — the tile shows a bounded live preview, labeled as one in the footer, and replaces it with the complete numbers on its own.
The trade is explicit: Epic Sum Up’s numbers are as fresh as the page load; ours are as fresh as the last hourly update, and they say so. Details in Freshness & performance.
Hierarchy and scope
Epic Sum Up follows Jira’s parent field and adds its own layer. Its containers are a custom parent type that can be stacked to any height and filled either through a container link field or through work item links, which lets it build structures Jira itself does not have — across teams and beyond the levels Advanced Roadmaps (Plans) defines — with the documented caveats that containers do not show in Plans and that link-based structures can differ depending on where you open them (checked on 2026-09-02). Its dashboard gadget takes a saved filter or a JQL query, shows the matching parent issues with their progress bars in configurable columns, and pages the list at 15 to 50 visible issues per page (checked on 2026-09-02).
Hierarchy Totals follows exactly one thing: Jira’s parent field. Sub-task → story → epic → whatever Advanced Roadmaps levels sit above, for the projects you pick — issue links are never followed, and there is no custom hierarchy to define. That is deliberate: the number you see in the tile is the number Jira’s own hierarchy gives, which is what a stakeholder can verify by opening the epic. Scope is a project list (up to 50) plus an optional JQL filter of up to 500 characters that keeps the tree structure — matched issues stay under their parents rather than collapsing into a flat list. The what’s counted panel prints the exact JQL behind the totals with a “Run it in Jira” link, so any figure can be checked against a plain Jira search.
Trend and history
Because Epic Sum Up computes on demand and, by its own FAQ, does not store the summed values, the history of a total is not something its listing or help center describe (as read on 2026-09-02) — its progress bars show where a parent stands now.
Hierarchy Totals stores its totals anyway, so the daily full re-read also keeps one point per project per day, and the tile draws them on demand — no report to schedule, no export to keep.
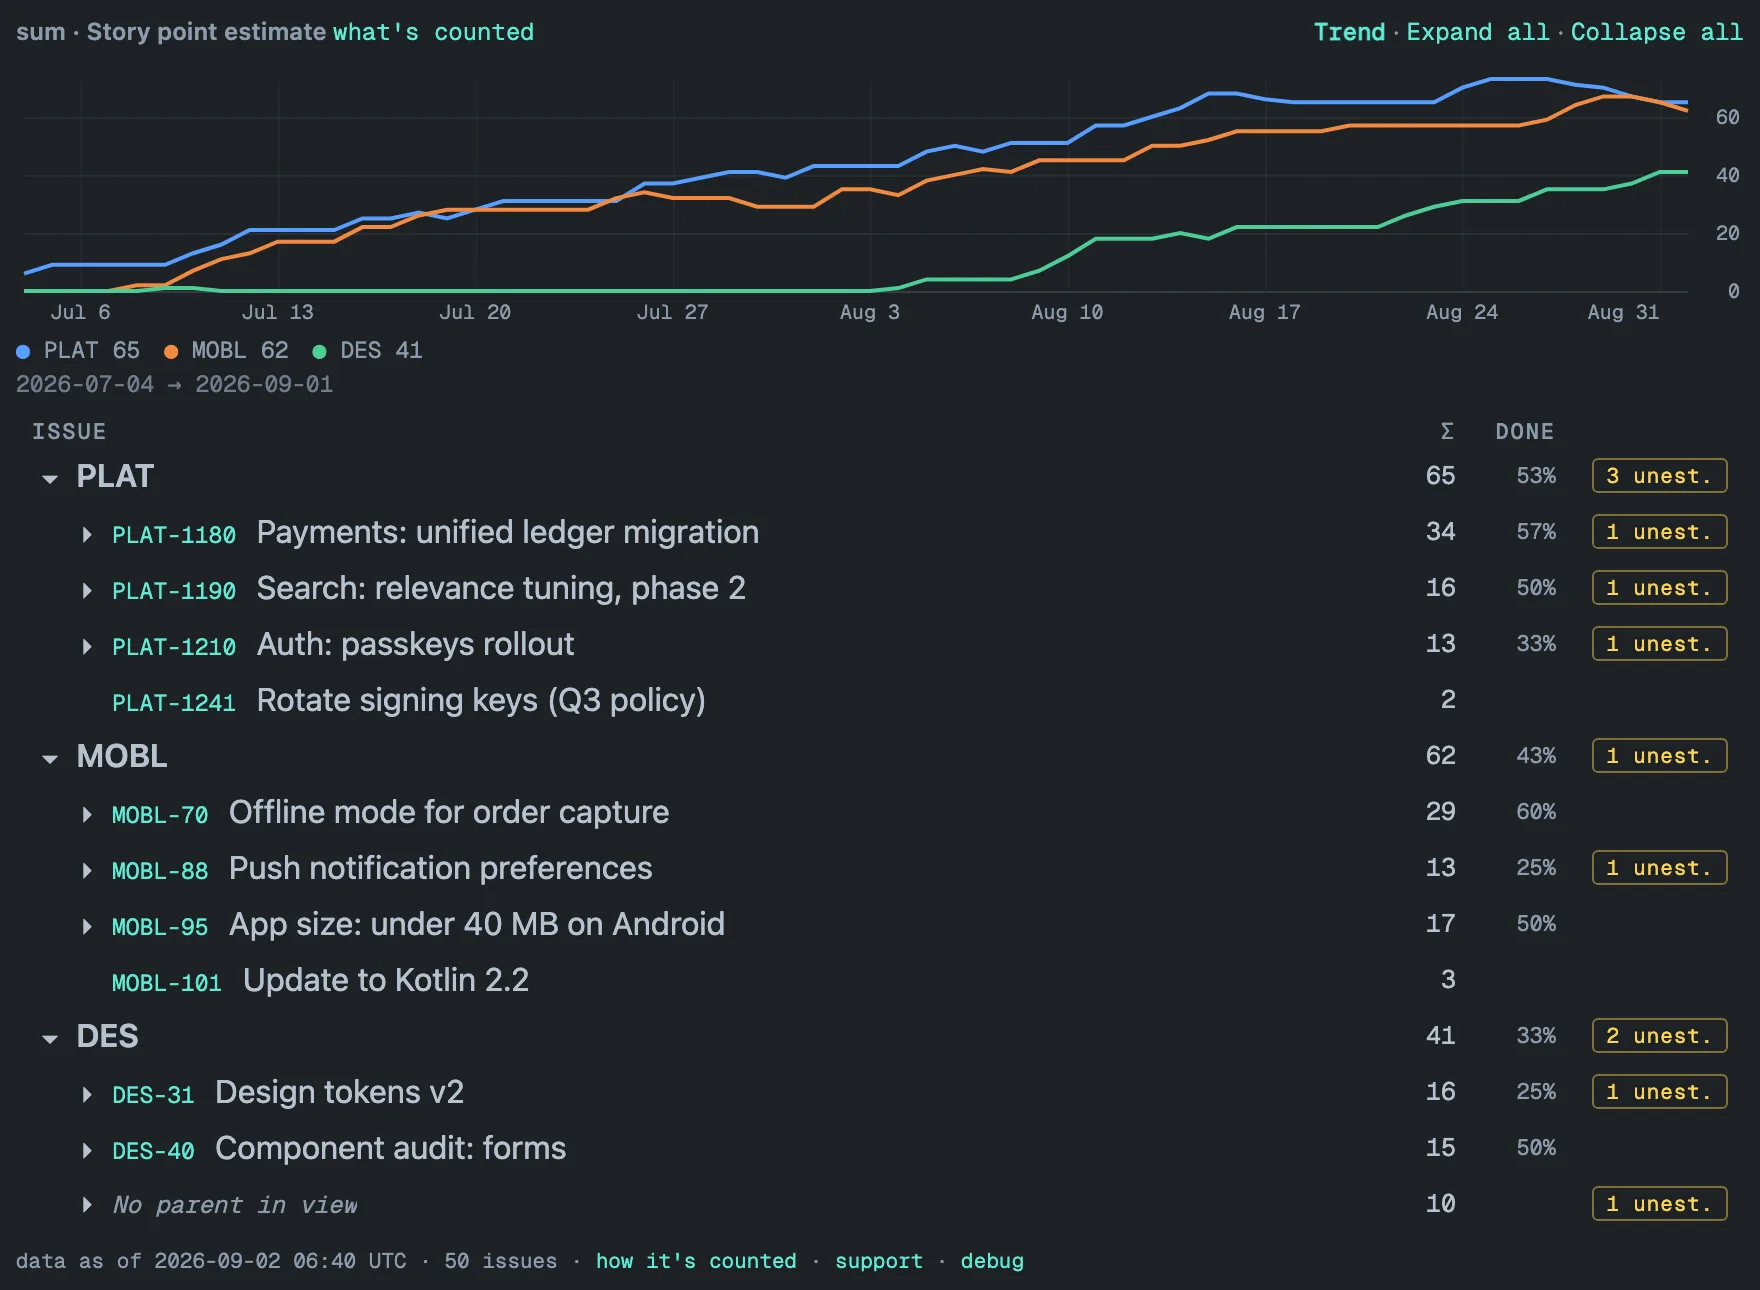
A line appears from the second day; a filtered gadget’s trend starts the day it is configured; and the trend is withheld from a viewer who cannot see the whole configured scope. More in Trends.
Permissions and where the data lives
Both apps are in a good place here, and Epic Sum Up is ahead on paper.
Epic Sum Up’s Cloud listing carries the Runs on Atlassian and Cloud Fortified badges, and its help center’s security section explains what the first one means: hosted on Atlassian’s Forge platform, with customer control of data egress and data residency in the same region as the Jira site (checked on 2026-09-02). Its vendor pages add that project data stays inside the Jira instance. Because it edits issues, its Cloud version requests write scopes alongside the read ones (scopes shown on the listing’s version record, checked on 2026-09-02) — expected for an editor, and worth knowing for a security review.
Hierarchy Totals runs on the same Forge platform: the stored copy lives in Atlassian-hosted storage attached to your Jira site, the Jira scopes are read-only (the app cannot change an issue), there are no external servers and no telemetry, and the app is eligible for the Runs on Atlassian program — the badge itself is granted at listing, so we do not carry it yet. Every render is filtered by the viewer’s Browse permission and issue-level security: hidden projects are counted and named as hidden, never shown, and the trend is withheld rather than reveal a total that includes issues the viewer cannot open. Details in Security.
What Epic Sum Up does that Hierarchy Totals does not
This list is long on purpose. Everything here is from Epic Sum Up’s listing, features page and help center, checked on 2026-09-02.
- It lives in the issue view. The Summary Panel sits on the parent issue itself, with progress bars and counters. Hierarchy Totals is a dashboard gadget only; open an epic and there is nothing of ours on it.
- Money. Budget values per issue with budget markers on the progress bars, and personnel cost computed from hours worked and hourly rates. Hierarchy Totals has no currency, no rates and no budgets — it sums the field you point it at.
- Editing. The Detail View Editor is a spreadsheet-like view for creating, inline-editing and bulk-editing thousands of work items with copy and paste, and the dashboard gadget has an Allow Cell Editing toggle. Hierarchy Totals is read-only by design.
- Timesheets on work logs. Hierarchy Totals sums Time spent as a number; it has no worklog reporting.
- Containers. A custom parent type stacked to any height and filled via a link field or work item links, for structures Jira does not provide. Hierarchy Totals follows Jira’s parent field only.
- More kinds of values: time, story points, status category, custom calculations and expressions, and counts of attachments and comments. Hierarchy Totals takes number-type custom fields plus the three time fields, with six aggregates.
- Saved reporting templates in the Detail View Editor.
- Colour-coded progress bars as the primary visual — for example green while time spent is within the estimate, red once it exceeds it. Hierarchy Totals shows numbers, a DONE percentage and a trend line.
- Jira Server and Data Center, alongside Cloud. Hierarchy Totals is Cloud only.
- A free edition for the three time-tracking values, and a decade of Marketplace reviews.
What Hierarchy Totals does that Epic Sum Up’s public material does not describe (as read on 2026-09-02): a stored copy with measured render times at 31,000 and 47,000 issues; a “data as of” date on every render; a daily trend of the totals; a median; the Open work only mode; the amber unest. badge with a one-click view of only the unestimated branches; and up to 50 projects as bold per-project totals in one tile.
Feature-by-feature
| Epic Sum Up | Hierarchy Totals | |
|---|---|---|
| Where the numbers appear | Issue view (Summary Panel), a dashboard gadget, the Detail View Editor | A dashboard gadget |
| When they are computed | Live on open; not cached, not stored at issue level (help center and FAQ, checked 2026-09-02) | Background sync into a stored copy inside your Jira site; full re-read daily, hourly update; “data as of” in the footer |
| Performance at scale | Vendor positions it for over a thousand issues at once (features page, checked 2026-09-02) | 31,000 issues in about 1.5 s; 13 projects and 47,000 issues in under 3 s — render times of the stored copy |
| Hierarchy | Jira parent field plus containers of any height, via a link field or work item links | Jira parent field only (sub-task → story → epic → Advanced Roadmaps levels); no issue links |
| Cross-project view | Dashboard gadget over a saved filter or JQL, 15–50 visible issues per page | Up to 50 projects, a bold total row per project, up to 50,000 issues per render |
| Values and operations | Time, story points, status category, expressions, attachment and comment counts, budgets, personnel cost | Number-type custom fields + Original estimate, Time spent, Remaining estimate; sum, avg, min, max, count, median |
| Editing issues | Yes — inline and bulk, in the editor and the gadget | No — read-only scopes |
| Rollup values in JQL, search or an API | No — its FAQ: “JQL – no. ESU calculates summed values live, on-demand” (checked 2026-09-02) | Not today — totals live in the gadget; the what’s counted panel gives the scope’s JQL to run in Jira. Exposing rollup values to JQL and automations is a planned roadmap item |
| Trend history of totals | Not described in the listing or help center (checked 2026-09-02) | Yes — one point per project per day; daily 90 d → weekly 2 y → monthly |
| Unestimated work surfaced | Configurable counters in the Summary Panel | Amber “N unest.” badge per subtree, one click to show only those branches |
| Done share | Progress bars, including completed issues | The DONE column on parent rows |
| Data residency and trust | Runs on Atlassian and Cloud Fortified badges; Forge-hosted per its help center | Forge-hosted storage in your site, read-only scopes, no external servers, no telemetry; eligible for Runs on Atlassian |
| Hosting | Cloud, Server, Data Center | Jira Cloud |
| Pricing | Free on Jira sites with up to 10 users, then per-user monthly pricing that falls with the tier — $0.90 per user per month at the 100-user tier (pricing tab, checked 2026-09-02) | Free on Jira sites with up to 10 users; paid tiers billed through the Marketplace, published with the listing |
| Maturity, install base, reviews | 1,755 installs, rated 4.1 across 44 reviews, reviews since 2016 (checked 2026-09-02) | On the Atlassian Marketplace since 2026-09-17 — judge us by the changelog and roadmap |
What its users say
The public reviews (checked on 2026-09-02) are consistent with the picture above. A top-rated review (4 of 4 stars, the scale the Marketplace used until May 2026) from October 2025 uses it for per-project overviews on dashboards and for managing budget visually, and praises the responsiveness of the team; another 4-of-4 review from March 2025 relies on it daily for budgets and scope control. Older reviews name the limits: a 3-of-4 review from November 2018 says it solves rolling up time spent and story points from sub-task to epic but finds the documentation brief, and a 2-of-4 review from March 2018 asks for the roll-up fields to be reachable from search or an API — which, per the vendor’s FAQ, is still not how the product works.
When Epic Sum Up is the right call
Choose it when the roll-up belongs on the epic — when the people who need the number are the ones opening the issue, when you track budgets or personnel cost in hours and rates, when you want to fix estimates or fields in the same screen that shows the totals, when your structure needs a parent type Jira does not have, or when you run Server or Data Center. It is a mature, well-regarded product with a decade of reviews — that is precisely why it is the comparison worth making.
Using Hierarchy Totals as an Epic Sum Up alternative — and when not to
Choose Hierarchy Totals when the number you need is a total over a hierarchy on a dashboard — a program’s remaining story points, a portfolio’s effort across a dozen projects, the hours logged under every epic in a division — and you want it rendered from a stored copy rather than computed while you wait, dated on screen, with unestimated work counted rather than hidden, with a trend that goes back to the day you added the gadget, and kept inside your Jira site under read-only scopes.
Do not choose it as a replacement for Epic Sum Up’s issue-view panel, its editor, its timesheets or its budgets — none of those exist here, and none are on the roadmap under those names. Many teams would sensibly run both: Epic Sum Up on the epic, Hierarchy Totals on the portfolio dashboard.
Start with Getting started; questions go to the FAQ or to support. For the same comparison against a dashboard suite rather than an issue-view tool, see Hierarchy Totals vs Rich Filters.
[ questions ]
▸Is Hierarchy Totals an Epic Sum Up alternative?
For one job, yes: totals of story points, estimates or time rolled up Jira's issue hierarchy on a dashboard, across up to 50 projects, with a daily trend and a visible data-as-of date. It does not replace Epic Sum Up's issue-view Summary Panel, budgets and personnel cost, inline editing, timesheets or containers.
▸Can either app expose rollup totals to JQL or an API?
Epic Sum Up's own FAQ says its summed values are calculated live and cannot be queried in JQL; sorting by them works only inside its Detail View Editor. Hierarchy Totals shows its totals in the gadget only: today there is no API and no export. Its what's counted panel does give you the JQL of the scope behind each rollup so you can run the same query in Jira, and exposing rollup values to JQL and automations is a planned roadmap item.
▸How do the two apps handle a large Jira site?
Epic Sum Up computes when a panel or gadget opens, and its vendor describes working with over a thousand issues at once. Hierarchy Totals renders a stored copy kept by a background sync: a 31,000-issue portfolio in about 1.5 seconds and 13 projects with 47,000 issues in under 3 seconds, with a cap of 50 projects and 50,000 issues per gadget.