[ guide · published 2026-09-02 · updated 2026-09-20 ]
Roll up story points in Jira without Premium
by Andrey Pavlov · Claused
Short answer: no, you do not need Jira Premium to roll up story points across the Jira hierarchy. What Premium sells is Plans — a planning tool that rolls up estimates and dates inside a plan — plus the right to add hierarchy levels above epic. The hierarchy itself, the parent field that ties sub-tasks to stories and stories to epics, exists on every Jira Cloud plan, and so do the numbers on the issues. What Standard and Free lack is a place where those numbers are added up through the tree. This guide lays out what Premium adds, what you already have, and the Standard-plan way to get the totals onto a dashboard.
Two notes on words. Jira Cloud comes in four plans — Free, Standard, Premium and Enterprise (Explore Jira Cloud plans, Jira pricing) — and “Premium” below means Premium or Enterprise. And Atlassian’s documentation now says work item where most Jira users, and this page, still say issue.
What Premium adds for rollups
Three separate things, and it is worth separating them because most teams want only one.
1. Plans (formerly Advanced Roadmaps). Plans combines work from several boards, projects and filters into one planning view with scheduling, capacity and dependencies. Atlassian’s overview states that Plans is included with Jira Premium, and the page header says the feature is only available on Premium and Enterprise (What are plans in Jira Premium?).
2. Hierarchy levels above epic. Out of the box Jira has three levels: Subtask (level −1), Story (level 0) and Epic (level 1). Adding a level above Epic — an initiative, say — “is only available as part of Jira Cloud Premium and Enterprise” (Configure the work type hierarchy). One detail matters later: a level created during a Premium period does not vanish when the plan changes. Atlassian’s KB on the “Need Premium subscription to set parent” error describes exactly that situation — the custom hierarchy is preserved after the Premium subscription ends, but can no longer be configured or used to set new parents.
3. Roll-ups inside the plan. In a plan you can switch on roll-ups so that a parent infers its dates, estimates, releases, sprints and teams from its children, from the View settings menu (What are roll-ups in my plan?). Rolled-up estimates are rounded to one decimal place for story points and two for hours and days (How your plan rolls up estimates). Two things to know about them: they live in the plan’s timeline view, not on a dashboard; and they are planning values — Atlassian notes that rolled-up dates are not saved to the work items when you commit changes back to Jira.
So Premium gives you a hierarchy deeper than epic and a planning screen where the tree is summed. It does not put the total on a dashboard, and the rolled-up numbers stay in the plan.
What Standard and Free already have
Sprint totals in the backlog. Once a Scrum board estimates in story points or time, the backlog shows a total per sprint (Enable estimation). One sprint, one board, no hierarchy.
The epic panel and the epic report. Both look at one epic at a time. The backlog’s epic panel expands an epic’s details on that board (Manage epics in a scrum space); the epic report “shows a list of complete, incomplete, and unestimated work items in an epic” and applies to Scrum boards only (View and understand the epic report). Useful for the epic in front of you; nothing for the thirty epics across four teams.
Dashboard statistics gadgets. Two Dimensional Filter Statistics (“Displays tabular data based on a filter”), Work item Statistics and the Pie Chart gadget all break a filter’s issues down by a field — and they count issues. None of the built-in gadgets sums a numeric field (Dashboard gadgets). If the question is “how many”, they answer it; if it is “how many points”, they do not.
Automation. This is the real Standard-plan rollup. Atlassian’s KB
Sum up story points and display value in parent work item
uses the smart value {{lookupIssues.Story Points.sum}} to write the total
of an epic’s stories into a number field on the epic whenever a story is
created or edited. The template library’s
Sum up story points and keep parent and subtask in sync
does the sub-task → parent step with {{issue.subtasks.Story Points.sum}},
and a further KB covers
epics → initiative.
It works, with four costs:
- One rule per level. Sub-task → story, story → epic, epic → initiative are three rules, each maintained separately.
- It recalculates only when a rule fires. With the rule as written in the KB, an edit updates the parent of the issue that triggered it; the epic a story just left keeps its old sum until one of its remaining stories is edited.
- Every run is metered. Automation has a monthly allowance that refreshes each month and is smaller on Free and Standard than on Premium (How is your automation usage calculated). A busy multi-project rule can spend it.
- The sum becomes a field. A number stored on the epic looks exactly like an estimate to every other report, so a tool that later sums epics and stories together counts the same points twice.
What each option can and cannot do
| Option | Plan | Sums a field? | Follows the hierarchy? | Across projects? | Shows where |
|---|---|---|---|---|---|
| Sprint totals in the backlog | Free, Standard | Yes — one sprint | No | One board | Backlog |
| Epic panel, epic report | Free, Standard | Progress of one epic; the report lists done, incomplete and unestimated issues | One epic at a time | One board | Backlog, reports |
| Statistics gadgets (Two Dimensional Filter Statistics, Work item Statistics, Pie Chart) | Free, Standard | No — counts issues | No | Yes, any filter | Dashboard |
| Automation rule | Free, Standard (metered) | Yes — written into a field on the parent | One level per rule, when the rule fires | With multi-project rules | The parent issue |
| Plans with roll-ups | Premium, Enterprise | Yes — estimates and dates, inside the plan | Yes, including levels above epic | Yes | The plan’s timeline (rolled-up dates are not saved to the issues on commit) |
| Hierarchy Totals gadget | Standard, Premium, Enterprise (Free untested) | Yes — sum, avg, min, max, count or median of a number field or a time field | Every level of the parent field, including levels above epic where they exist | Up to 50 projects per gadget | Dashboard |
Hierarchy Totals: the Standard-plan option
Hierarchy Totals is a Jira Cloud dashboard gadget by Claused, on the Atlassian Marketplace. It follows Jira’s parent field and only that — the same field on every plan — so on Standard it rolls sub-task → story → epic, and on a site that has levels above epic, whether configured on Premium or kept from a Premium period, those levels appear as parents like any other. It does not follow issue links and it does not need Plans.
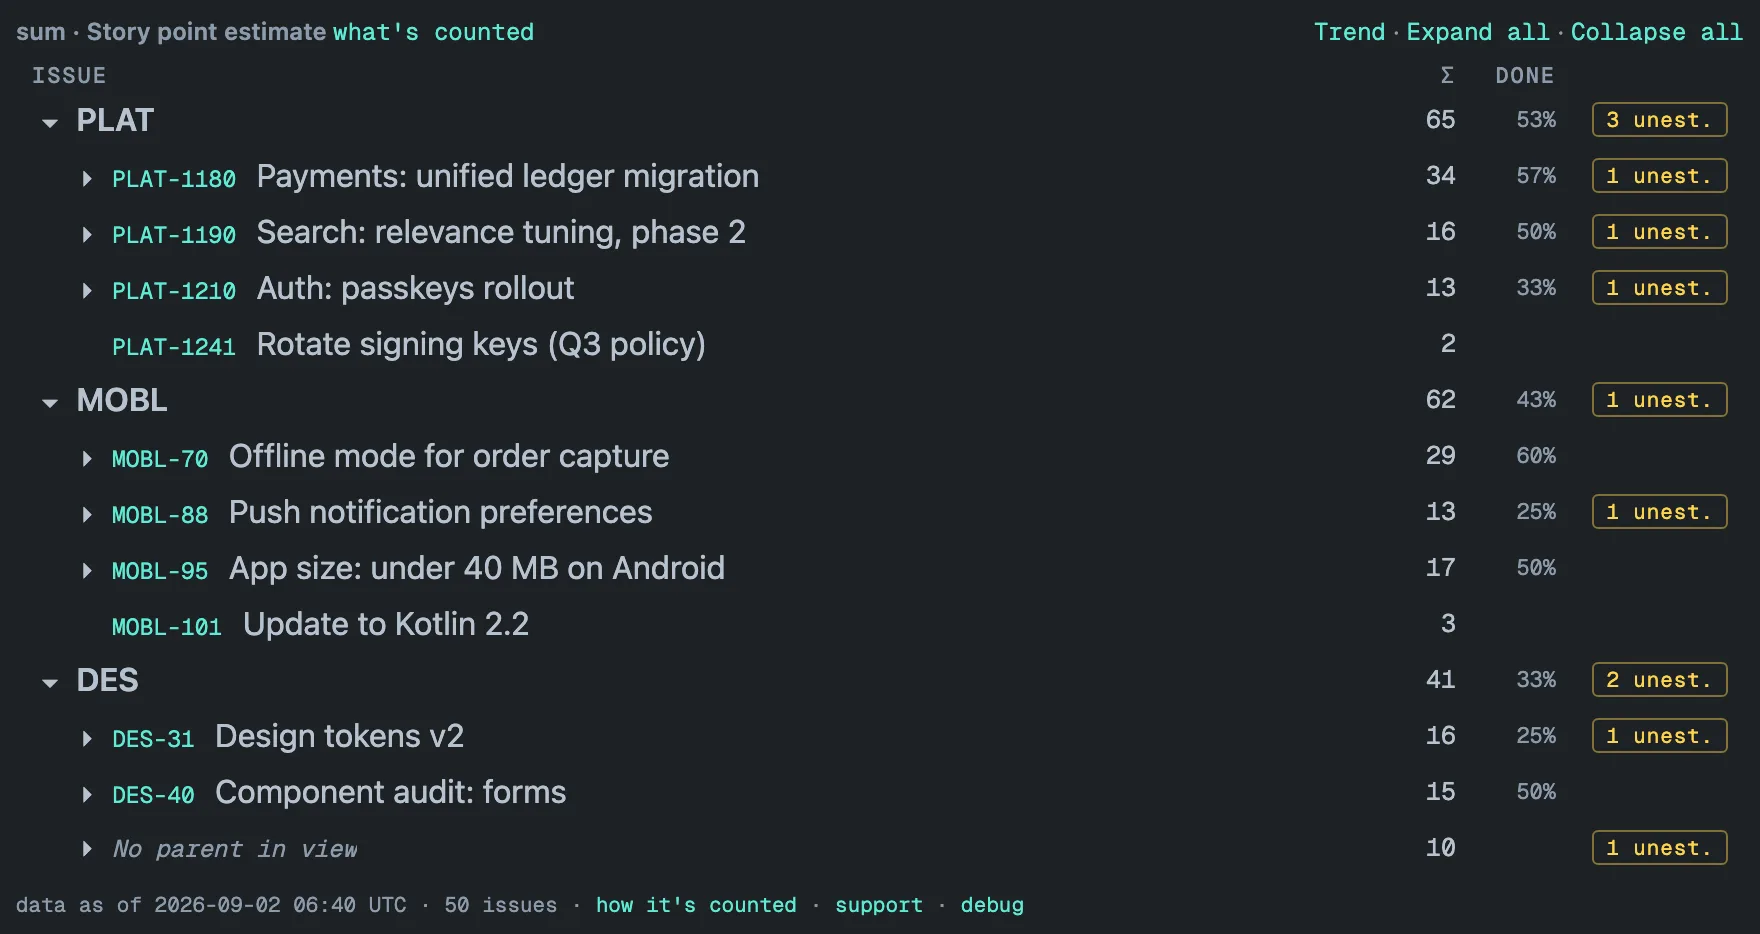
What you configure. Up to 50 projects; a number-type custom field such as
Story point estimate, or one of Original estimate, Time spent and Remaining
estimate shown in hours; one of sum, avg, min, max, count or median; an
optional JQL filter of up to 500 characters; and Open work only, which
drops issues whose status category is Done — the same as
statusCategory != Done. How rollups work
writes down the rules: every row aggregates itself plus everything below,
averages divide by estimated issues only, and a median is taken over the
whole subtree rather than over sub-totals.
What you read. The Σ column carries the total on every row; the DONE column shows, on parent rows, the share of the work under the row that is done; an amber unest. badge counts the unestimated leaves below a row; on a parent row, clicking it narrows the tree to those branches. Issues whose parent is outside the gadget’s scope are gathered under No parent in view (four or more per project; fewer are listed as top-level rows — see how rollups work), so nothing is silently dropped or double-counted.
Where the numbers come from. The tile reads a stored copy of your issues that the app keeps inside your Atlassian site: a full re-read of every configured project once a day, at an hour the Forge platform picks, with an hourly update in between. The first pass after you save takes minutes to an hour or more on a large site, and the gadget shows a bounded live preview meanwhile. Because the tile reads a prepared result, a 31,000-issue portfolio renders in about 1.5 seconds and a 13-project, 47,000-issue portfolio in under 3 seconds — both are render times of the stored copy, up to 50,000 issues per render (measured performance). The footer’s data as of stamp says how fresh the numbers are, and because totals are captured every day the gadget can draw a trend per project from the second day on. The freshness and performance doc has the details.
Who sees what. Every viewer sees only the projects they can browse and the issues their issue security allows; hidden projects are reported as hidden, never shown, and the trend is withheld when issue security hides issues in scope. The app has read-only scopes, stores its data in Forge-hosted storage inside your Atlassian site, calls no external servers and sends no telemetry; it is eligible for Atlassian’s Runs on Atlassian program. Security covers this in full. It is free on Jira sites with up to 10 users; paid tiers are billed through the Marketplace and published with the listing.
What it is not. It is not Plans: no scheduling, capacity or dependency tracking. It does not export, expose an API or edit issues, and it cannot create hierarchy levels — it follows the ones your site has.
Setting it up on a Standard site
- A Jira admin installs the app from the Marketplace listing, once for the site.
- On a dashboard, choose Add gadget and add Hierarchy Totals.
- On first view, approve the one-time Allow access request.
- Open the gadget’s settings, tick your projects, pick the field and the aggregate, and save. The live preview appears at once; the complete numbers arrive when the first background pass finishes.
The getting started doc walks through each screen.
When you do need Premium
If the problem is scheduling — capacity per team, dependencies between epics, what-if scenarios, a timeline that moves when a story slips — that is Plans, and no gadget replaces it. If you want to create a level above epic rather than roll up one you already have, only Premium and Enterprise can configure it. For everything else in this guide — the total of a hierarchy, across projects, on a dashboard, kept up to date — Standard is enough. The companion guides cover every native way to sum story points and how a rollup should be computed.
[ questions ]
▸Does Hierarchy Totals need Jira Premium or Plans?
No. It follows Jira's parent field, which every Jira Cloud plan has. On Standard that is sub-task → story → epic. If your site also has levels above epic — configured on Premium, or left in place after a Premium period — they are parents like any other and roll up with no extra setup.
▸Can Jira Standard roll up story points to an epic on its own?
Not through the hierarchy. The backlog totals one sprint, the epic panel and the epic report look at one epic's children on one board, and the dashboard statistics gadgets count issues rather than sum a field. An Automation rule can write a sum into a field on the parent — one level per rule, recalculated each time the rule fires.
▸Does a rollup gadget replace Plans?
Only the totals. Plans is a planning tool: scheduling, capacity, dependencies, scenarios, and roll-ups of dates and estimates inside the plan. If you need those, you need Premium. If you need the totals on a dashboard, you do not.
▸Which Jira Cloud plans can install Hierarchy Totals?
It is distributed through the Atlassian Marketplace and follows the parent field, so Standard, Premium and Enterprise are covered. Jira Free lists apps and integrations as available, but with limitations Atlassian does not detail, and we have not verified the gadget on a Free site yet. The app itself is free on Jira sites with up to 10 users; paid tiers are billed through the Marketplace and published with the listing.