Hierarchy Progress
updated 2026-09-21
Hierarchy Progress is the second dashboard gadget in the app. Hierarchy Totals answers “how much”; this one answers “how far along”.
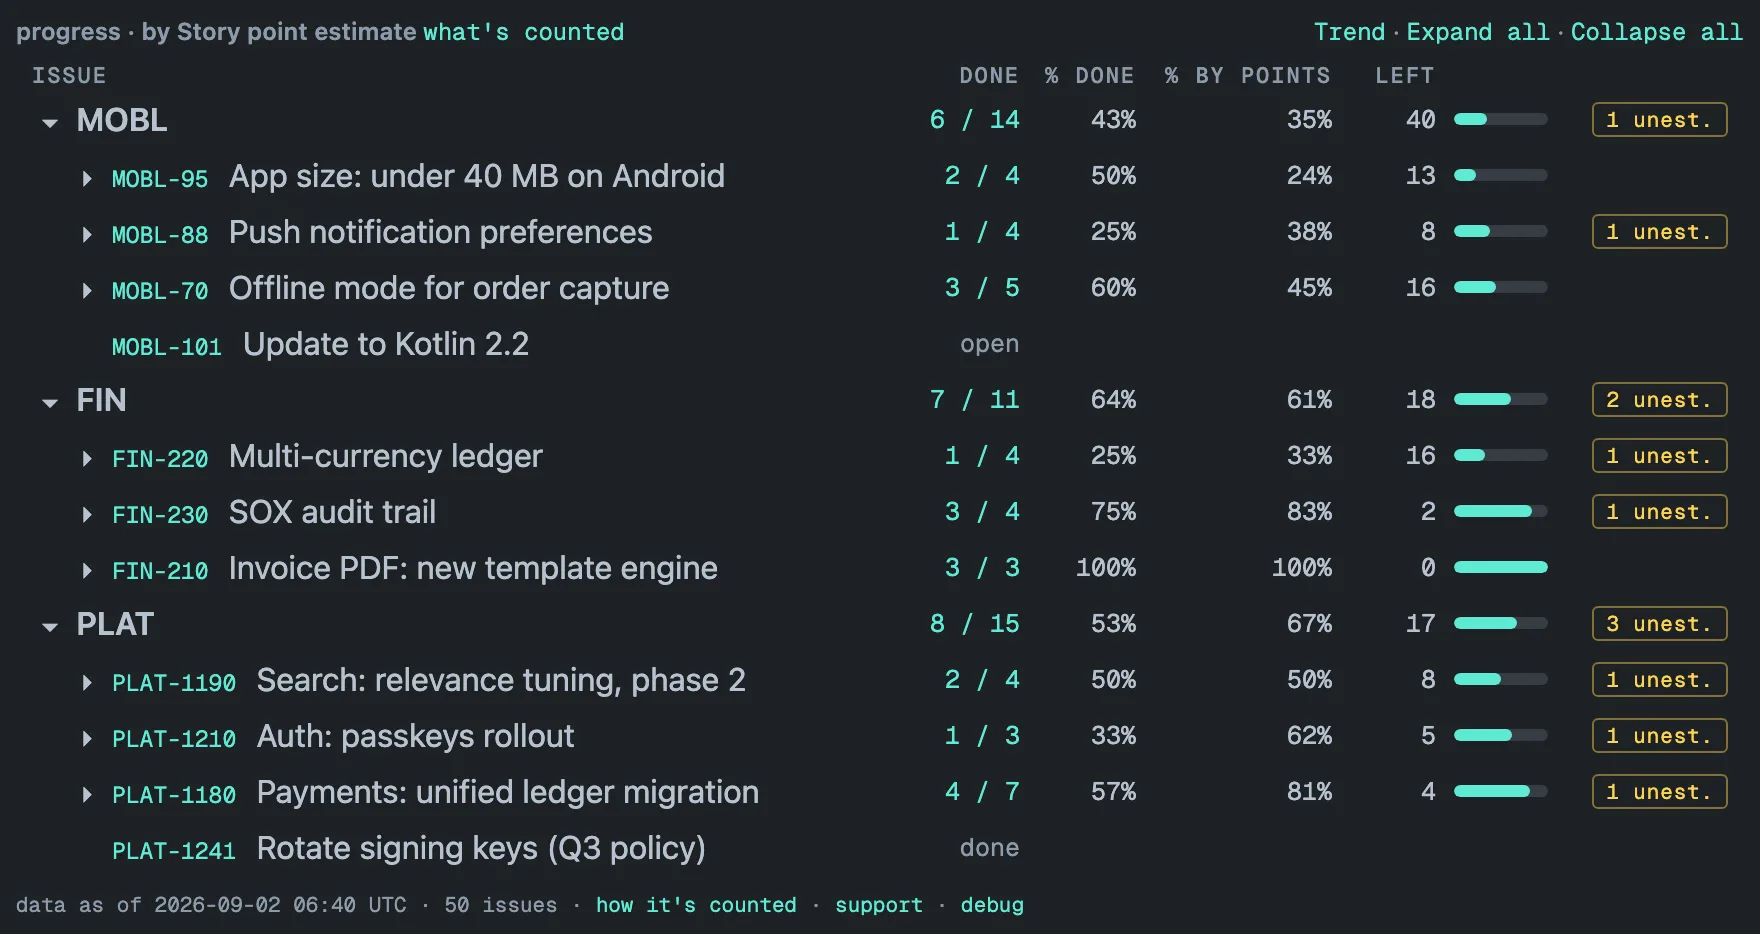
Every epic, every level above it and every project shows done out of total, percent done by issue count, percent done by weight — story points or any numeric field — and what is left.
It reads the same stored copy as Hierarchy Totals, so it needs no sync of its own and covers up to 50 projects in one tile.
Add and configure it
On a dashboard choose Add gadget and search for Hierarchy Progress. It is part of the same app: a site that has Hierarchy Totals already has it.
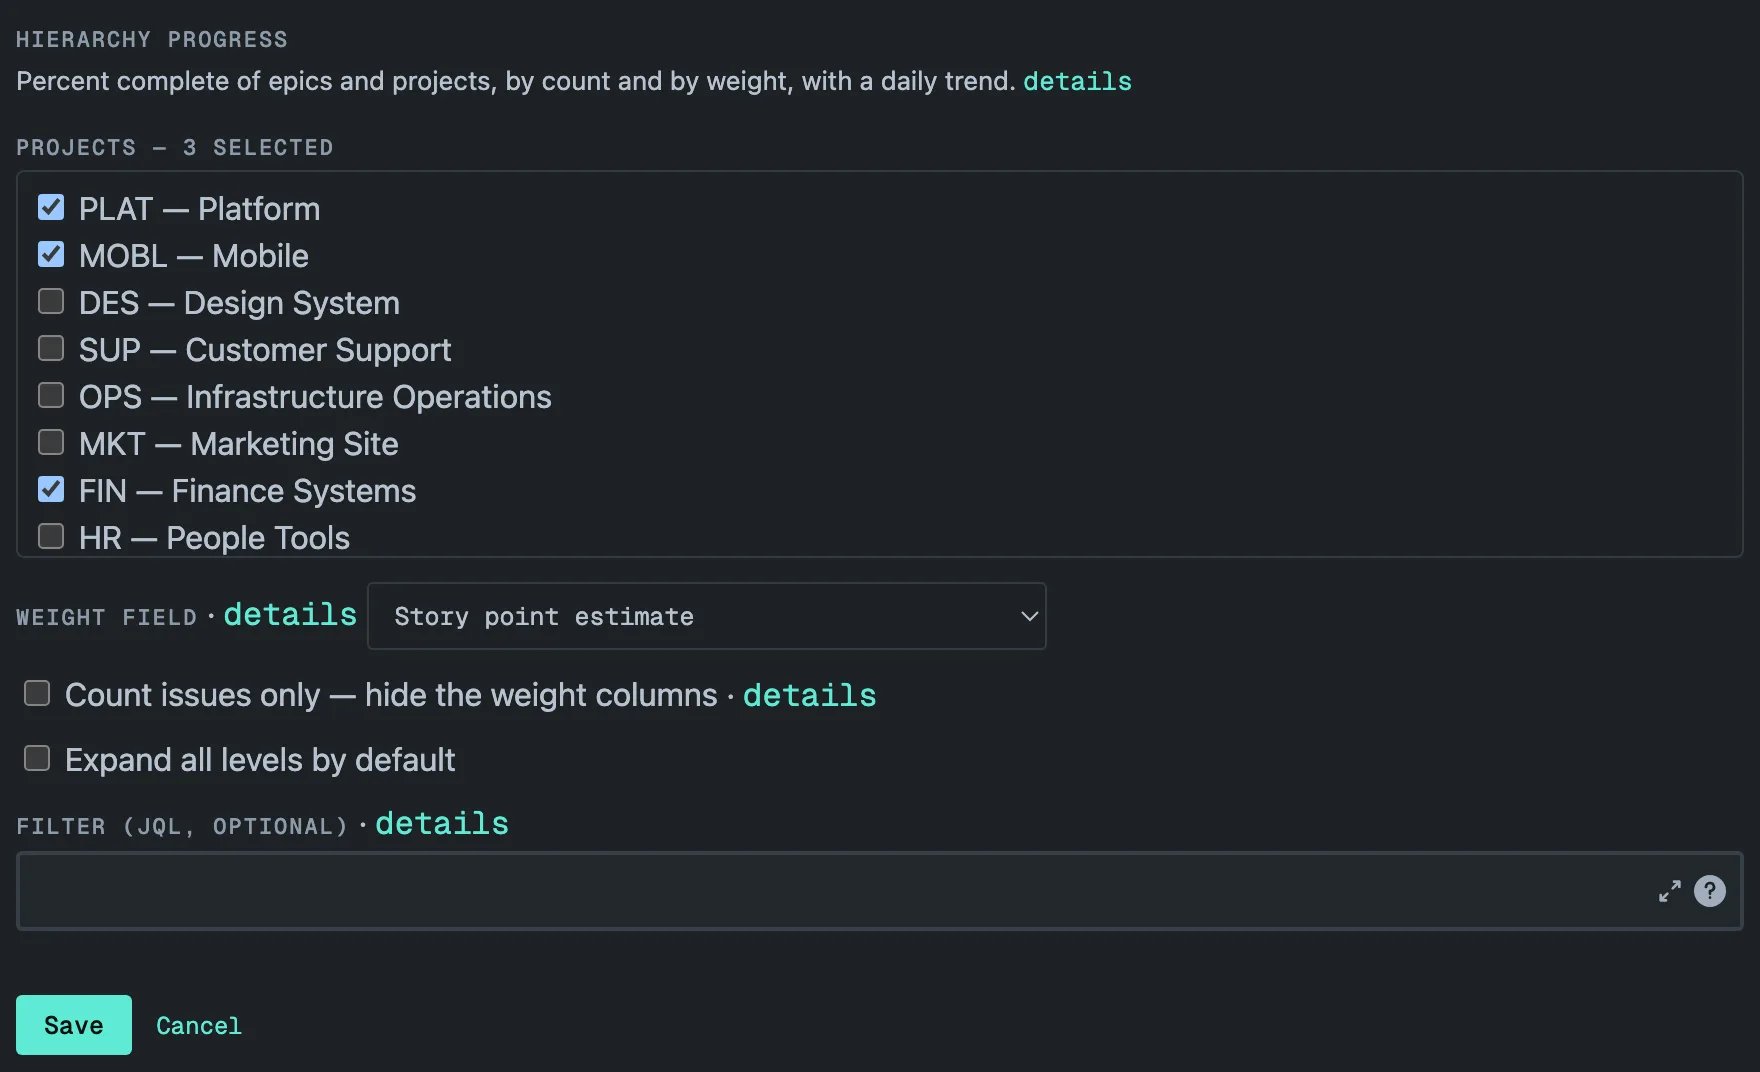
- Projects — up to 50, the same picker as Hierarchy Totals.
- Weight field — the number the percentage is weighed by: Story point estimate, Story Points, any number field of your own, or one of the three time-tracking fields. Team-managed projects keep estimates in Story point estimate, company-managed ones in Story Points.
- Count issues only — hide the weight columns — see Count issues only.
- Expand all levels by default — start with the whole tree open.
- Filter (JQL, optional) — see Filtering with JQL.
There is no Aggregate and no Open work only here: the gadget always reads every status, because a share of done work needs the done work.
Save needs at least one project and a weight field, and a filter within 500 characters.
Reading the tile
The header says what the share is by: progress · by Story point estimate,
or progress · by issue count, with · filtered when a JQL filter is set.
What’s counted opens the exact query, as in Hierarchy Totals. Its second
sentence names why DONE can be lower than the number of issues that query
finds in Jira: DONE counts work items only — epics and stories with
sub-tasks are not counted, their work is.
- DONE — work items done out of all work items under the row:
4 / 7. On an epic the figure is a link that opens the issues under the row in Jira’s issue search; on a project row it opens the project’s issues. The list is the hierarchy the number was counted over — the epic itself and any stories with sub-tasks are in it — so Jira shows more issues than the work-item count. See The DONE link. - % DONE — the same two numbers as a share, by issue count.
- % BY POINTS — the share done by weight. The header reads
% by pointsfor a story-point field,% byand the field’s name when the name is one short word, and% by weightotherwise. - LEFT — the weight of the work still open, in the field’s own unit.
- The bar draws the share by weight, or by count when the gadget counts issues only.
- unest. badge —
N unest.on a row whose subtree holds issues with no value in the weight field.
An issue with nothing below it shows the word done or open in the DONE
column, with no share, bar or remainder; an unestimated one keeps its
1 unest. badge. It is the work, not a container of work, so it has no
share of its own.
Laggards come first. Among the rows of one level, the lowest share is listed first — by weight, or by count when the gadget counts issues only. Rows without a share follow, and No parent in view and No value set stay last in their project.
A project with nothing under it still gets its row. It reads 0 / 0 with
the reason beside its name: no issues, nothing matches under a filter,
not loaded yet during a live preview, above the size cap or
not fully read when a read stopped short.
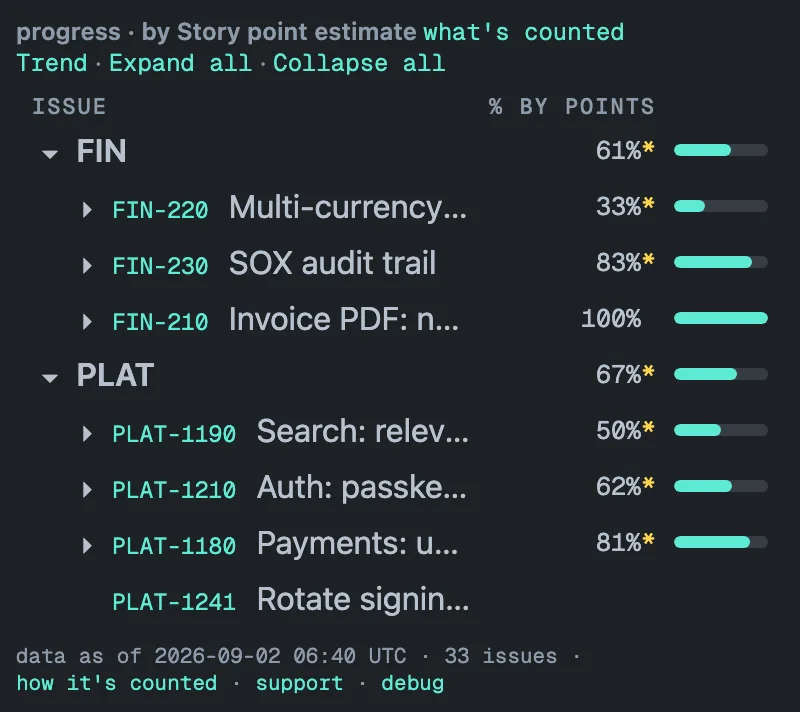
The tile drops columns as it narrows. At 720 px and wider it shows all of them. From 521 to 719 px it keeps DONE, the main share and the bar. At 520 px and below it keeps the main share and the bar, so keys and summaries stay readable.
Below 720 px the N unest. badge has no column of its own. A * in the
warning colour follows the share instead, on every row where work is
unestimated. Hover it for the count. On a row with children, click it for
the unestimated-only view, as the badge does on a wide tile. How it’s
counted explains the mark while one is on screen. The same mark stands in
for the partial chip on a row whose branch arrived incomplete. A gadget
that counts issues only marks no unestimated work: it has no weight to
qualify.
How it’s counted
How it’s counted in the footer opens the rule in the tile’s own words, with your field’s name in it.
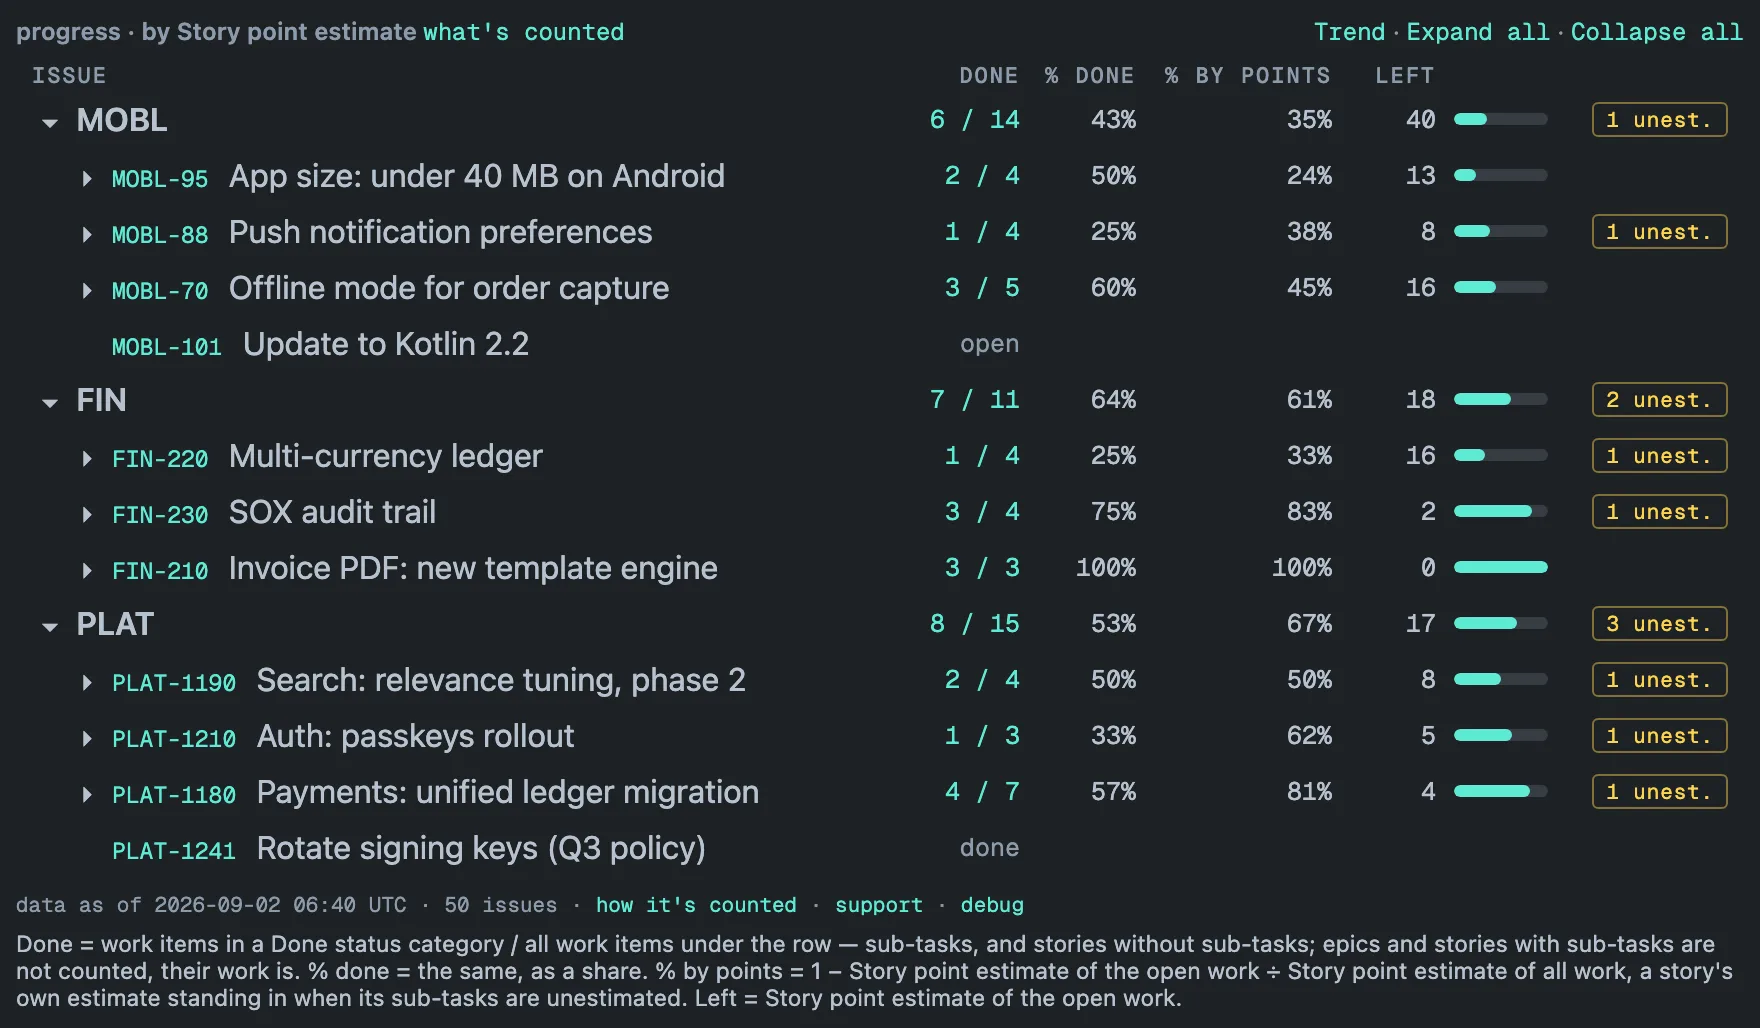
Work items. The gadget counts the issues that have nothing below them:
sub-tasks, stories without sub-tasks, standalone tasks. An epic, or a story
with sub-tasks, is never counted itself — its work is. An open epic whose
two stories are done reads 2 / 2, not 2 / 3.
The DONE column of Hierarchy Totals counts by the same rule, so both tiles on one dashboard print the same percentage for the same row.
Done means Jira’s status category Done, the same test as
statusCategory = Done. Cancelled, Rejected and Won’t Do count as done.
Resolution is not read. An issue whose status is unknown counts as open.
% done is done work items divided by all work items under the row.
% by points is 1 − the weight of the open work ÷ the weight of all work under the row. Each work item weighs its own value in the field.
A story’s own estimate stands in for its sub-tasks when none of them is estimated — points on the story, sub-tasks unsized. The story’s own status then decides whether that weight is done. The count is not affected: its sub-tasks are still the work items.
Left is the weight of the open work under the row.
Percentages are rounded, but 0% and 100% appear only when they are exact. A row with one open work item among hundreds reads 99%.
Unestimated work and the dash
A work item with no value in the weight field weighs nothing. It still counts in DONE and % DONE.
The N unest. badge counts those work items under the row. On a row with
children it is a button that narrows the tree to the unestimated branches,
as in Drill-down.
When some of the open work under a row is estimated and some is not, the share by weight is taken over the estimated part, and the badge says how much was left out.
When none of the open work under a row has a value — or nothing under
the row has one at all — the row shows — in % BY POINTS and in LEFT. Open
work of unknown size is not 100% done, so the gadget prints no number
there. Hovering the dash in % BY POINTS says which of the two cases it is,
and % DONE beside it still stands.
A row with a dash is not ranked as the worst laggard. It follows the rows that have a share.
Count issues only
For teams that do not estimate, tick Count issues only — hide the weight columns.
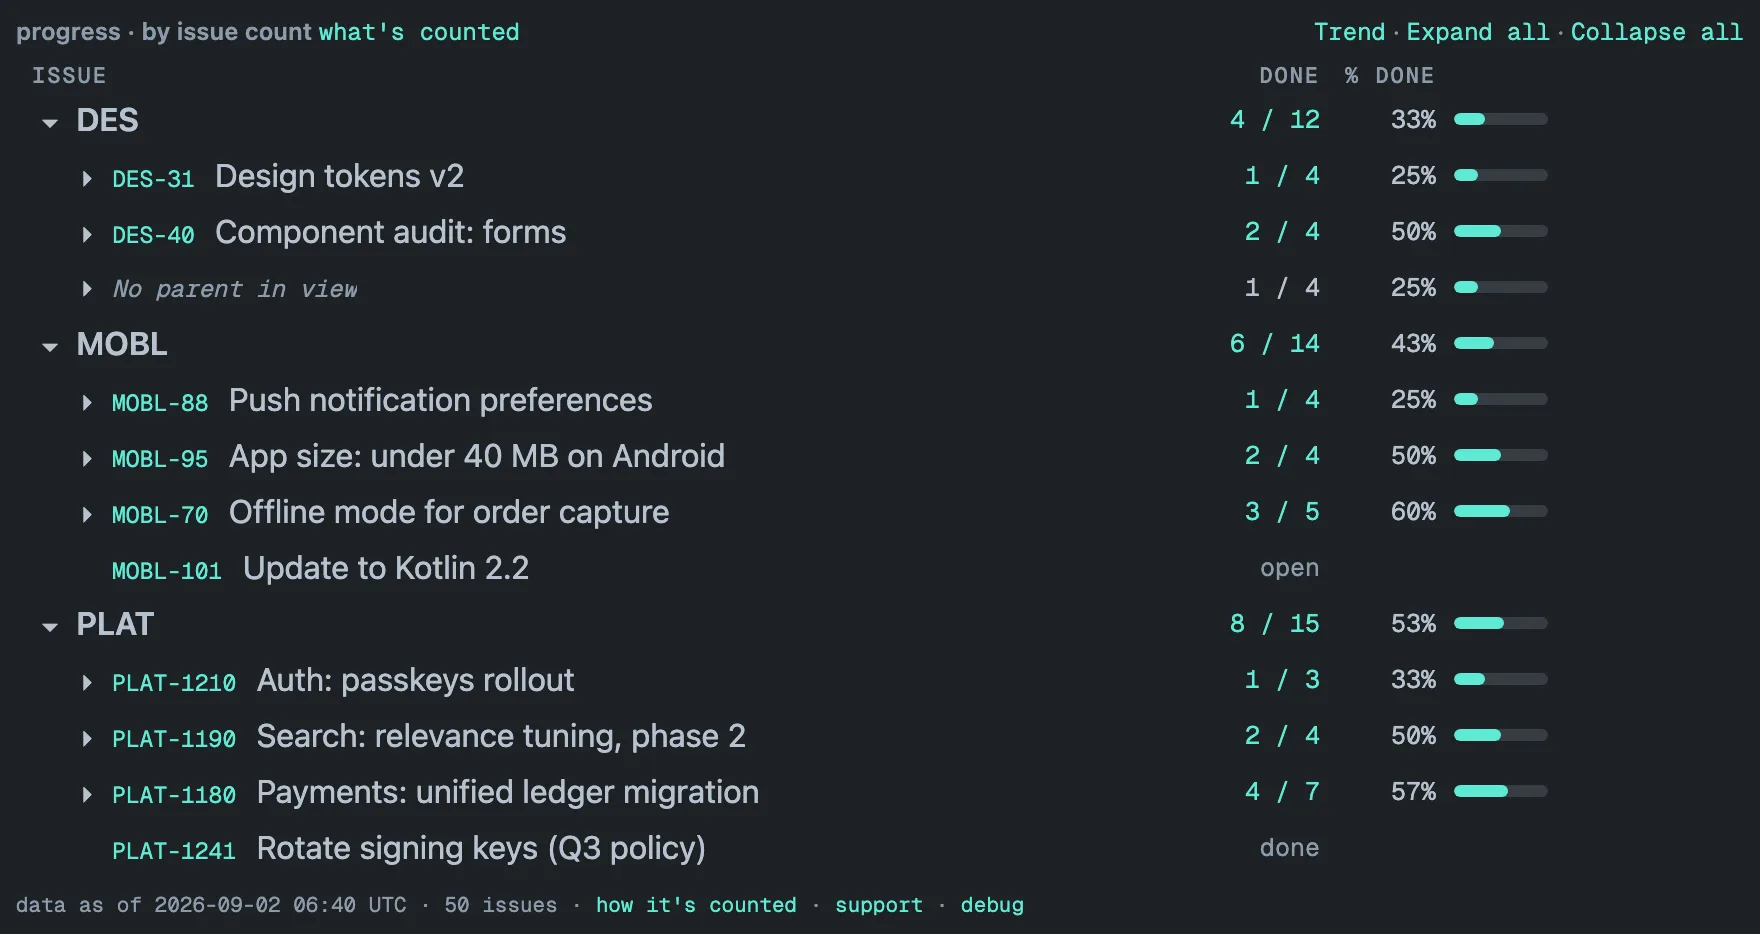
The tile keeps DONE, % DONE and the bar, now drawn by count. % BY POINTS, LEFT and the unest. badges are gone, and how it’s counted names only the count rule.
A weight field is still required. The stored copy and the trend are kept per field, so pick any — its values are not shown. Nothing is grouped by it either: standalone issues stay where the hierarchy puts them, never under No value set. No parent in view still gathers issues whose parent is outside the gadget.
The trend of such a gadget draws the share by issue count.
The trend
Click Trend and a chart opens above the table: one line per project, showing that project’s percent complete day by day — by weight, or by count when the gadget counts issues only.
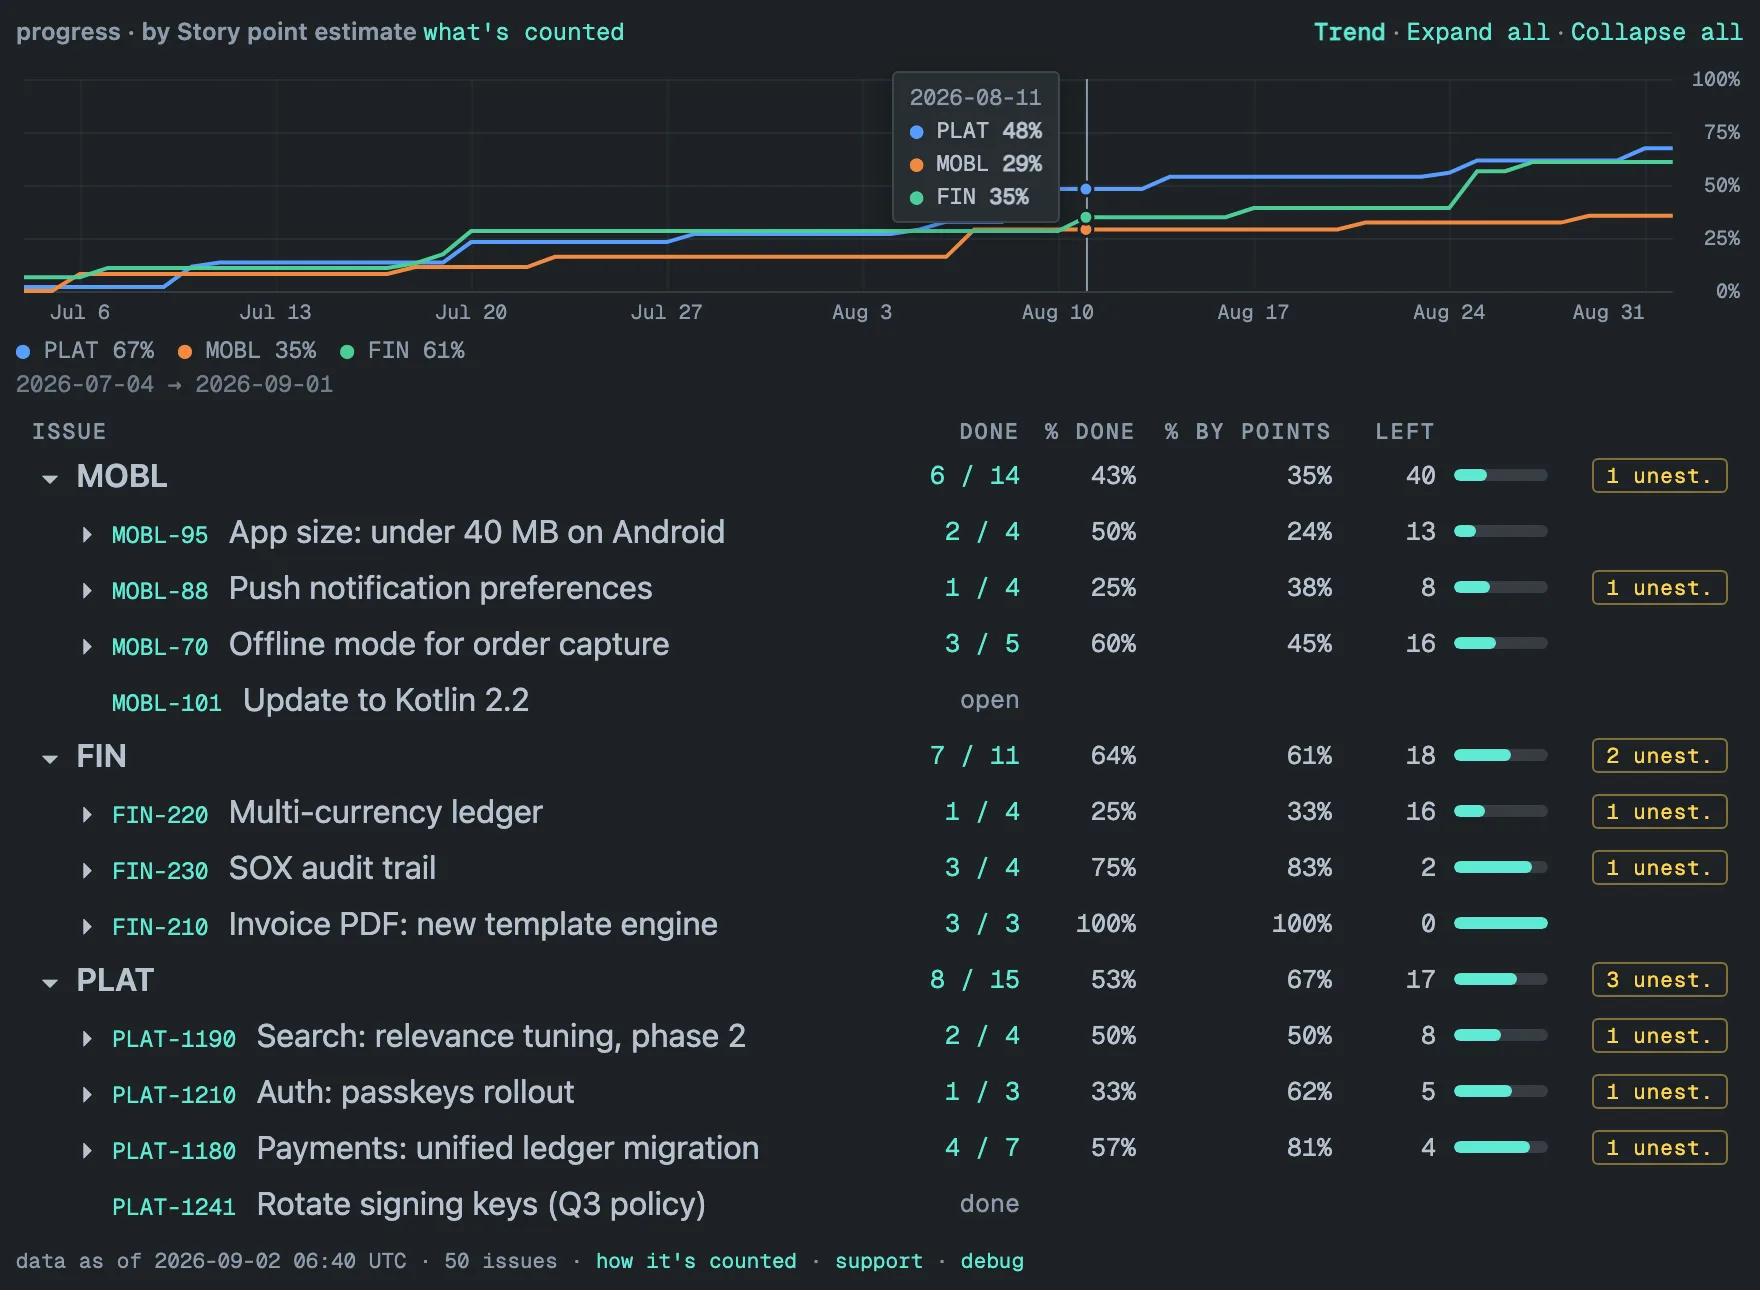
The line and the tile are counted by the same rule.
When it starts. One point is stored per day, when the daily full re-read finishes. The first point lands with the first full pass or full re-read after the gadget is set up, and a line needs two points, so the chart appears from the second day. Nothing earlier exists: history is observed, never rebuilt from Jira’s issue history.
On a site that already ran Hierarchy Totals on the same projects and field, the days stored before this version carry totals but no share. The panel says so, and the line starts on the first day captured after the upgrade.
A gap is a day with no answer: a project with no work that day, or open work that could not be weighed. The line skips it rather than draw a guess.
One line per project — or a single line for a filtered gadget. There is no line per epic or per initiative.
The trend records the share done on each day. It does not forecast an end date.
Who may see a line, how long points are kept and the series budget are the same as for Hierarchy Totals — see Trends & history.
Filtering with JQL
The Filter (JQL, optional) field works as in Filtering with JQL: it narrows the gadget to the issues the query matches, on top of the selected projects, with the viewer’s permissions.
DONE, both shares and LEFT are then taken over the matched issues only.
Ancestors that did not match stay as structure rows and count as nothing.
The header shows · filtered, and the DONE links open the matched issues.
What counts as a work item under a filter. A filter such as
fixVersion = "2.0" matches a story and none of its sub-tasks — sub-tasks
do not inherit a fix version, a label or a component. The matched story is
then the work item itself: it counts as one by its own status and weighs
its own estimate. Its row shows done or open, like any issue with
nothing below it.
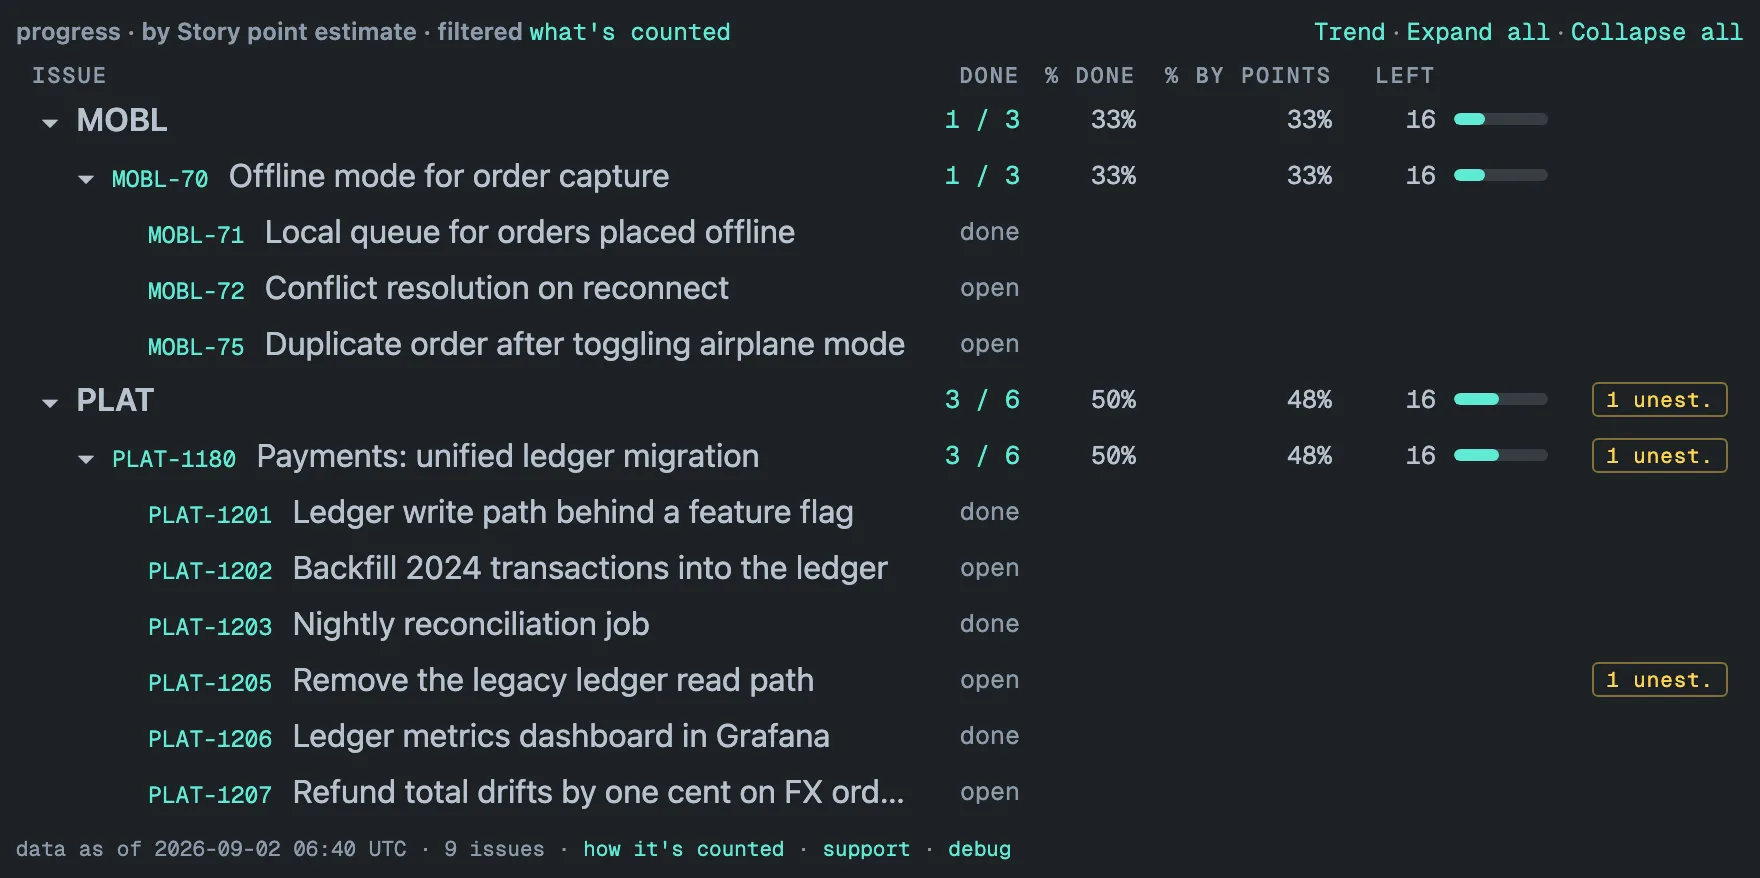
If such a story is open and has no value of its own — its points sit on
sub-tasks the filter left out — the share by weight of a row above it is
left unanswered when no other open work under that row has a value: —,
not 100%. Where other open work is estimated, the story weighs nothing, as
any unestimated work item does. How it’s counted adds this rule on a
filtered gadget.
A filtered gadget draws a single trend line, starting the day the filter is configured. It is withheld from some viewers; the rule is under Filtered gadgets.
The DONE link
The search behind a DONE figure is built from parents, not from a list of
every issue under the row. For the epic PLAT-1180 on an unfiltered gadget it
reads
project = "PLAT" AND (key = "PLAT-1180" OR parent in ("PLAT-1180", "PLAT-1202")):
the row, plus everything whose parent is the row or an issue under it that
has children. It is limited to the projects of the counted rows, and a
filtered gadget adds its filter.
An issue under the row that was deleted in Jira since the last sync is just absent from the list, whether it was a sub-task or a parent. The link opens a Jira error instead of the list only if the row’s own issue was deleted since the last sync. The daily full re-read removes deleted issues from the stored copy, and that row goes with them.
Limits
- Done is the status category Done. Resolution is not read.
- One trend line per project, or one for a filtered gadget. No history per epic or per initiative.
- The trend starts when the gadget is set up. Earlier days are not reconstructed.
- No forecast and no ideal line: the chart shows the share done on each captured day.
- Up to 50 projects per gadget, a 500-character filter and 50,000 issues per render, as for Hierarchy Totals — see Limits.
- The DONE link on an epic lists the row’s whole subtree while the row and the issues under it that have children of their own number up to 200; past that, or when some of its rows were held back, it opens the row’s direct children, and its tooltip says so.